 |
|||||||||
Follow us: |
|||||||||

LPBF announces the release of Hydrocoast maps for the Period of July 7th to July 13th
The Hydrocoast program collects a number of environmentally dynamic datasets in an effort to monitor the condition (salinity component) of the basin's estuaries. Wind, rain, tides and freshwater influx from streams and diversions are variables that cause salinity fluctuation, and play a vital role in the health of the basin's estuaries. The Hydrocoast program monitors these variables over a seven day period and produces bi-monthly map products showing the movement of water and salinity across the basin (using field data, MODIS, sattelite imagery, precipitation data, wind data and permanent monitoring stations in the basin such as USGS buoys, Coastwide Reference Monitoring System (CRMS), etc.). As a tool, these map products can be used for scientific discussion, restoration planning between state and federal agencies, and by the commercial and recreational fishery community.
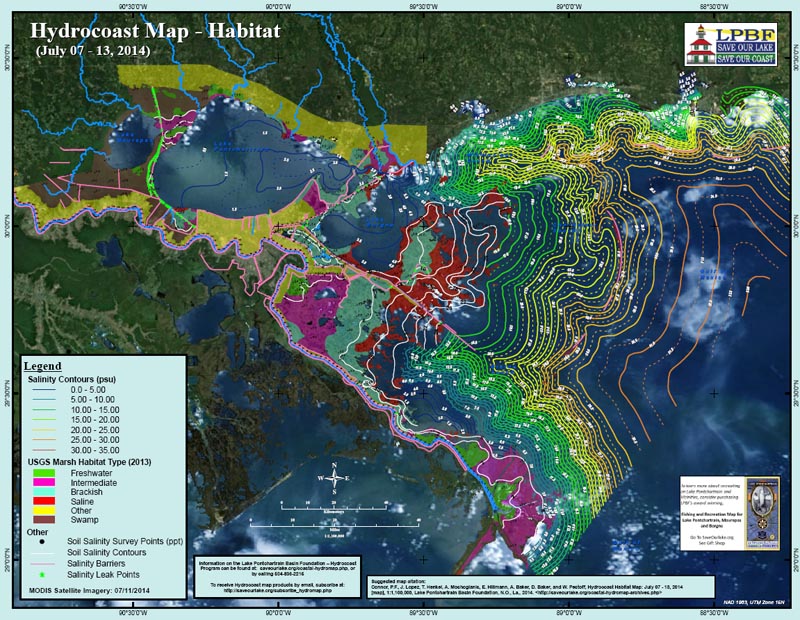
This Hydrocoast period is characterized by an increase in salinity throughout the basin. Salinity in Lake Pontchartrain increased from 1.5 ppt at the eastern edge to 3 ppt. Salinity in Chandeleur Sound increased from 13-20 ppt to 18-29 ppt. Salinity also increased significantly in the Cat Island Channel and Mississippi Sound. Average daily discharge difference between last Hydrocoast and the current was:
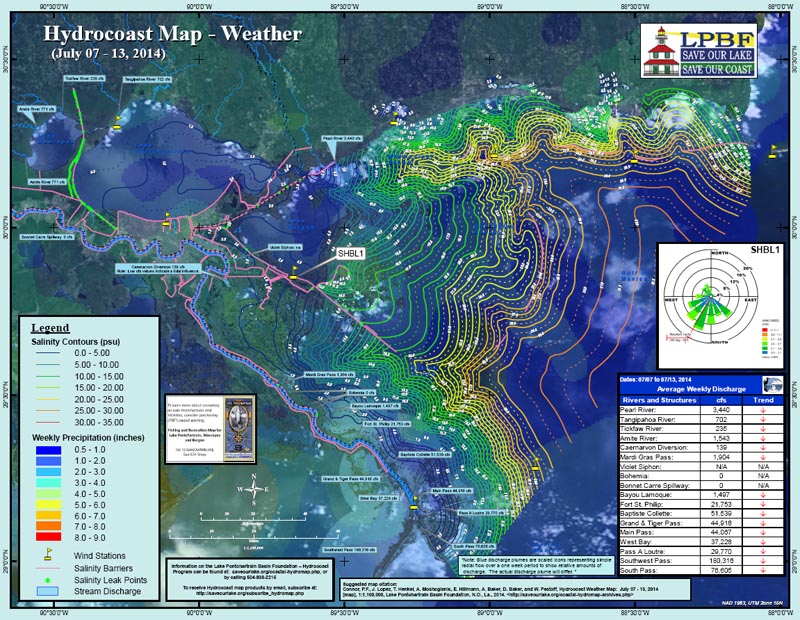
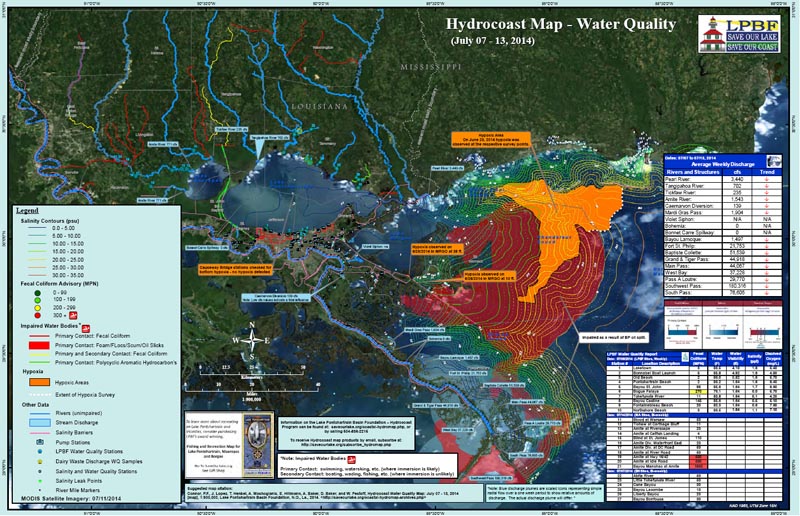
The Habitat Map shows soil water salinity contours across the land masses. During this Hydrocoast period there was some rainfall across the almost the entire basin, ranging from 0 to 3 inches. Resultant winds were variable ranging from northwest, southwest, south and southeast but were predominantly from the southwest. Wind speeds ranged from 0 to 8.8 m/s (2 to 20 miles/hr). During this Hydrocoast period, an elevated fecal coliform count was found at Bogue Falaya. High fecal coliform counts were found at Amite at Hwy 16/42, Amite at Idle Road and Bayou Manchac at Amite. The water quality map also shows the impaired water bodies for Primary Contact (swimming, immersion likely) and Secondary Contact (boating wading, immersion unlikely) in the basin as prepared by the Louisiana Department of Environmental Quality under the EPA 305(b)/303(d) guidelines. The map also shows an area of hypoxia in the Chandeleur Sound which was detected on June 23, 2014. During this Hydrocoast period, oyster harvest area 8 (spanning the Bird's Foot Delta) was closed while all other areas east of the Mississippi River remained open.
- Pearl River = 5,785 to 3,440 cfs
- Tangipahoa = 1,077 to 702 cfs
- Tickfaw = 359 to 235 cfs
- Amite = 3,699 to 1,543 cfs
- Caernarvon Diversion = 140 to 139 cfs
- Mardi Gras Pass = 2,240 to 1,904 cfs
- Violet Siphon = 260 to N/A cfs
- Bohemia Spillway = 0 to 0 cfs
- Bonnet Carré Spillway = 0 to 0 cfs
- Bayou Lamoque = 2,056 to 1,497 cfs
- Fort St. Philip = 28,891 to 21,753 cfs
- Baptiste Collete = 65,466 to 51,539 cfs
- Grand and Tiger Pass = 48,900 to 44,918 cfs
- Main Pass = 49,000 to 44,067 cfs
- West Bay = 41,100 to 37,228 cfs
- Pass A Loutre = 31,300 to 29,770 cfs
- Southwest Pass = 200,000 to 180,316 cfs
- South Pass = 84,400 to 76,605 cfs
- Pass A Loutre = 32,700 to 32,100 cfs
- Southwest Pass = 204,290 to 206,400 cfs
- South Pass = 86,570 to 85,400 cfs
To receive Hydrocoast products by email please email Hydrocoast@saveourlake.org with "subscribe" in the subject line. For more information on the Hydrocoast maps and to view archived maps please visit http://saveourlake.org/coastal-hydromap.php


###
To subscribe, send an email from the address you want subscribed to: ListServer@nwrccom.cr.usgs.gov with the subject "subscribe cwppra" without the quotation marks. |
Connect with us: |
|
Submit CWPPRA Newsflash Requests to: ruckstuhlc@usgs.gov |
||