 |
|||||||||
Follow us: |
|||||||||

LPBF announces the release of Hydrocoast maps for the Period of July 21st to July 27th
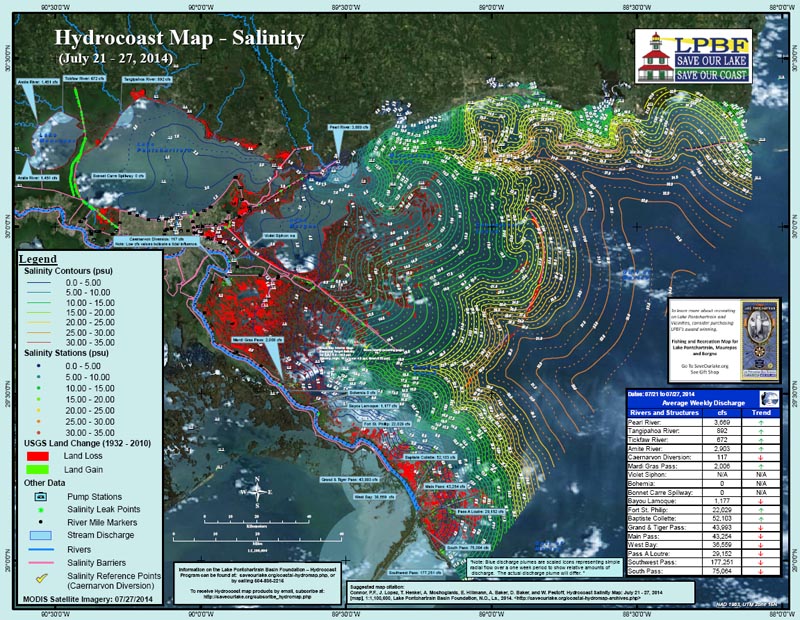
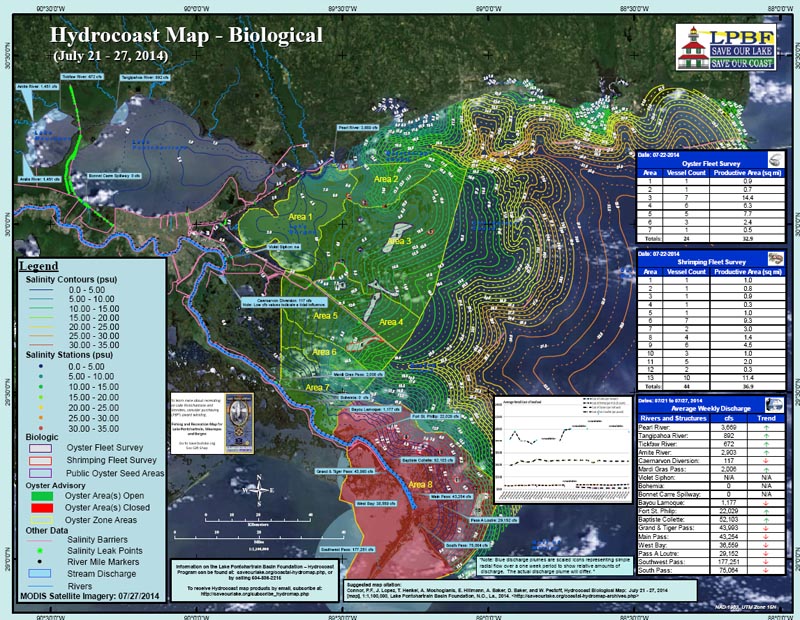
The Hydrocoast program collects a number of environmentally dynamic datasets in an effort to monitor the condition (salinity component) of the basin's estuaries. Wind, rain, tides and freshwater influx from streams and diversions are variables that cause salinity fluctuation, and play a vital role in the health of the basin's estuaries. The Hydrocoast program monitors these variables over a seven day period and produces bi-monthly map products showing the movement of water and salinity across the basin (using field data, MODIS, sattelite imagery, precipitation data, wind data and permanent monitoring stations in the basin such as USGS buoys, Coastwide Reference Monitoring System (CRMS), etc.). As a tool, these map products can be used for scientific discussion, restoration planning between state and federal agencies, and by the commercial and recreational fishery community.
This Hydrocoast period is characterized by a slight freshening in eastern Lake Pontchartrain, Mississippi Sound and Chandeleur Sound. The rest of the basin had similar salinity condition to the last Hydrocoast. Discharge increased in the northshore rivers and decreased in most of the Mississippi River outlets. Average daily discharge difference between last Hydrocoast and the current was
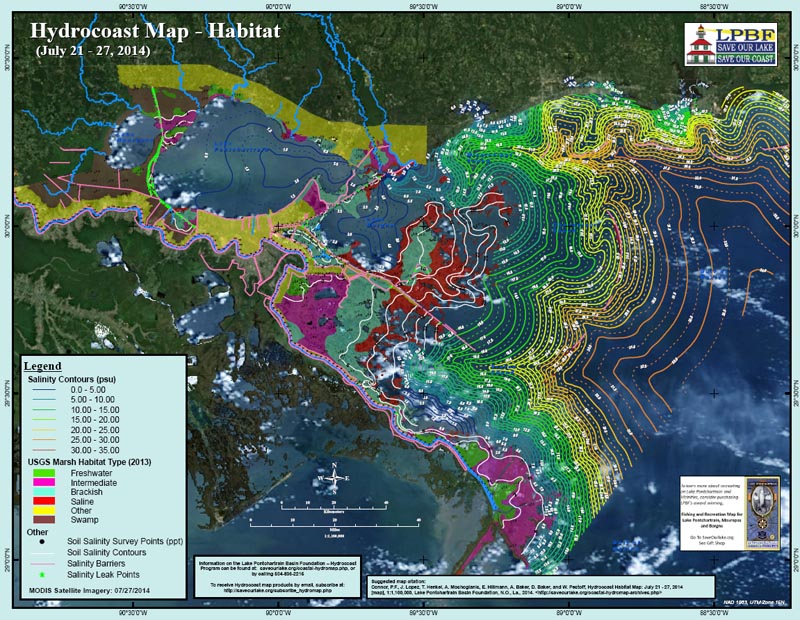
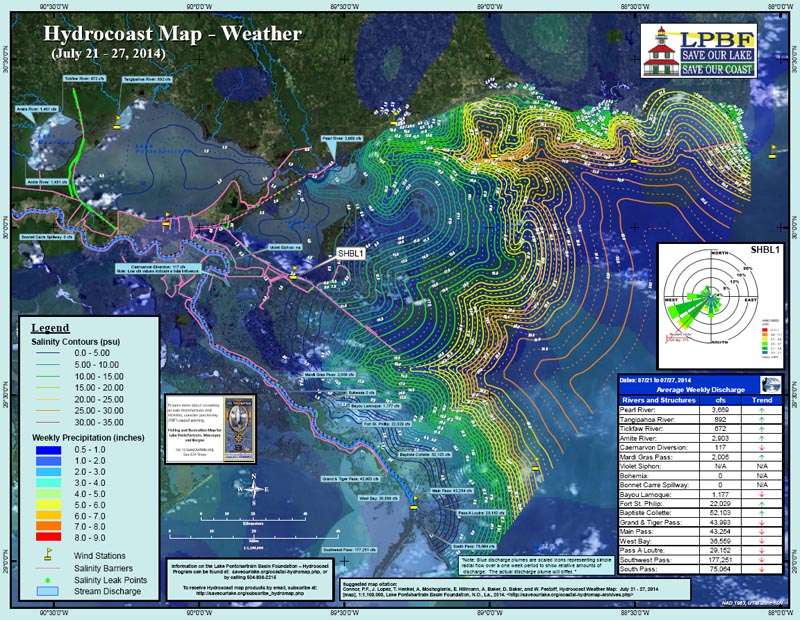
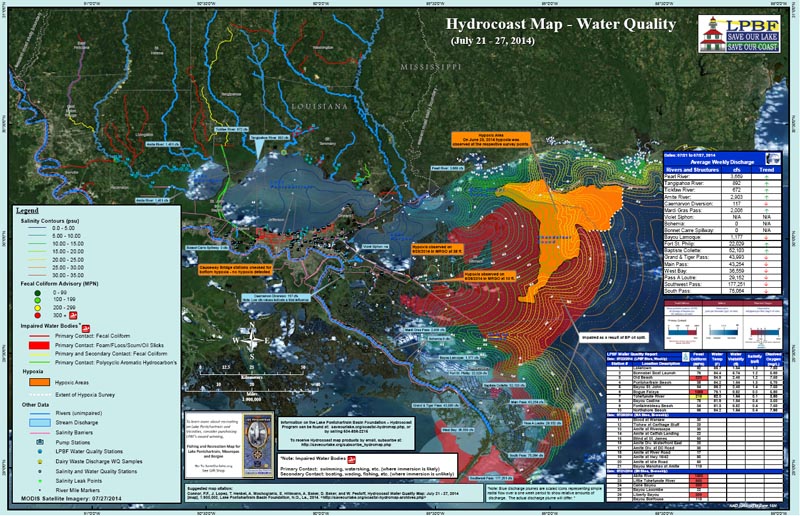
The Habitat Map shows soil water salinity contours across the land masses. During this During this Hydrocoast period there was spotty rainfall on the northshore and rain over most of the southern part of the basin, ranging from 1 to 3 inches. Resultant winds were mostly from the southwest. Wind speeds ranged from 0 to 8.8 m/s (2 to 20 miles/hr). During this Hydrocoast period, an elevated fecal coliform count was found at the Tchefuncte River. High fecal coliform counts were found at Old Beach, Bogue Falaya, Abita River, Little Tchefuncte River, Cane Bayou and Liberty Bayou. The water quality map also shows the impaired water bodies for Primary Contact (swimming, immersion likely) and Secondary Contact (boating wading, immersion unlikely) in the basin as prepared by the Louisiana Department of Environmental Quality under the EPA 305(b)/303(d) guidelines. The map also shows an area of hypoxia in the Chandeleur Sound which was detected on June 23, 2014. During this Hydrocoast period, oyster harvest area 8 (spanning the Bird's Foot Delta) was closed while all other areas east of the Mississippi River remained open. Also shown are the results of an aerial survey for shrimp and oyster boats conducted on July 22 at 7 am. There were 44 shrimp boats in the Biloxi Marshes and along the Mississippi River. There were 24 oyster boats found mostly in the Biloxi Marshes. Also shown on the map are the market prices for shrimp, hamper of crab, half sack of oysters and a pound of crawfish
- Pearl River = 3,440 to 3,669 cfs
- Tangipahoa = 702 to 892 cfs
- Tickfaw = 235 to 672 cfs
- Amite = 1,543 to 2,903 cfs
- Caernarvon Diversion = 139 to 117 cfs
- Mardi Gras Pass = 1,904 to 2,006 cfs
- Violet Siphon = N/A cfs
- Bohemia Spillway = 0 to 0 cfs
- Bonnet Carré Spillway = 0 to 0 cfs
- Bayou Lamoque = 1,497 to 1,177 cfs
- Fort St. Philip = 21,753 to 22,069 cfs
- Baptiste Collete = 51,539 to 52,103 cfs
- Grand and Tiger Pass = 44,918 to 43,993 cfs
- Main Pass = 44,067 to 43,254 cfs
- West Bay = 37,228 to 36,559 cfs
- Pass A Loutre = 29,770 to 29,152 cfs
- Southwest Pass = 180,316 to 177,251 cfs
- South Pass = 76,605 to 75,064 cfs
To receive Hydrocoast products by email please email Hydrocoast@saveourlake.org with "subscribe" in the subject line. For more information on the Hydrocoast maps and to view archived maps please visit http://saveourlake.org/coastal-hydromap.php
###
To subscribe, send an email from the address you want subscribed to: ListServer@nwrccom.cr.usgs.gov with the subject "subscribe cwppra" without the quotation marks. |
Connect with us: |
|
Submit CWPPRA Newsflash Requests to: ruckstuhlc@usgs.gov |
||